The sysadmin that watches your entire infrastructure 24/7
Pulse Patrol acts as a senior engineer that never sleeps. It automatically detects failing backups, ZFS rot, stalled containers, and config drift — across Proxmox, Docker, and Kubernetes.
Dashboards look cool.
But they don't fix
things.
You have Grafana graphs and Zabbix alerts. But do you actually look at them? Most homelab outages happen because "alerts were noisy" or "I didn't check the dashboard."
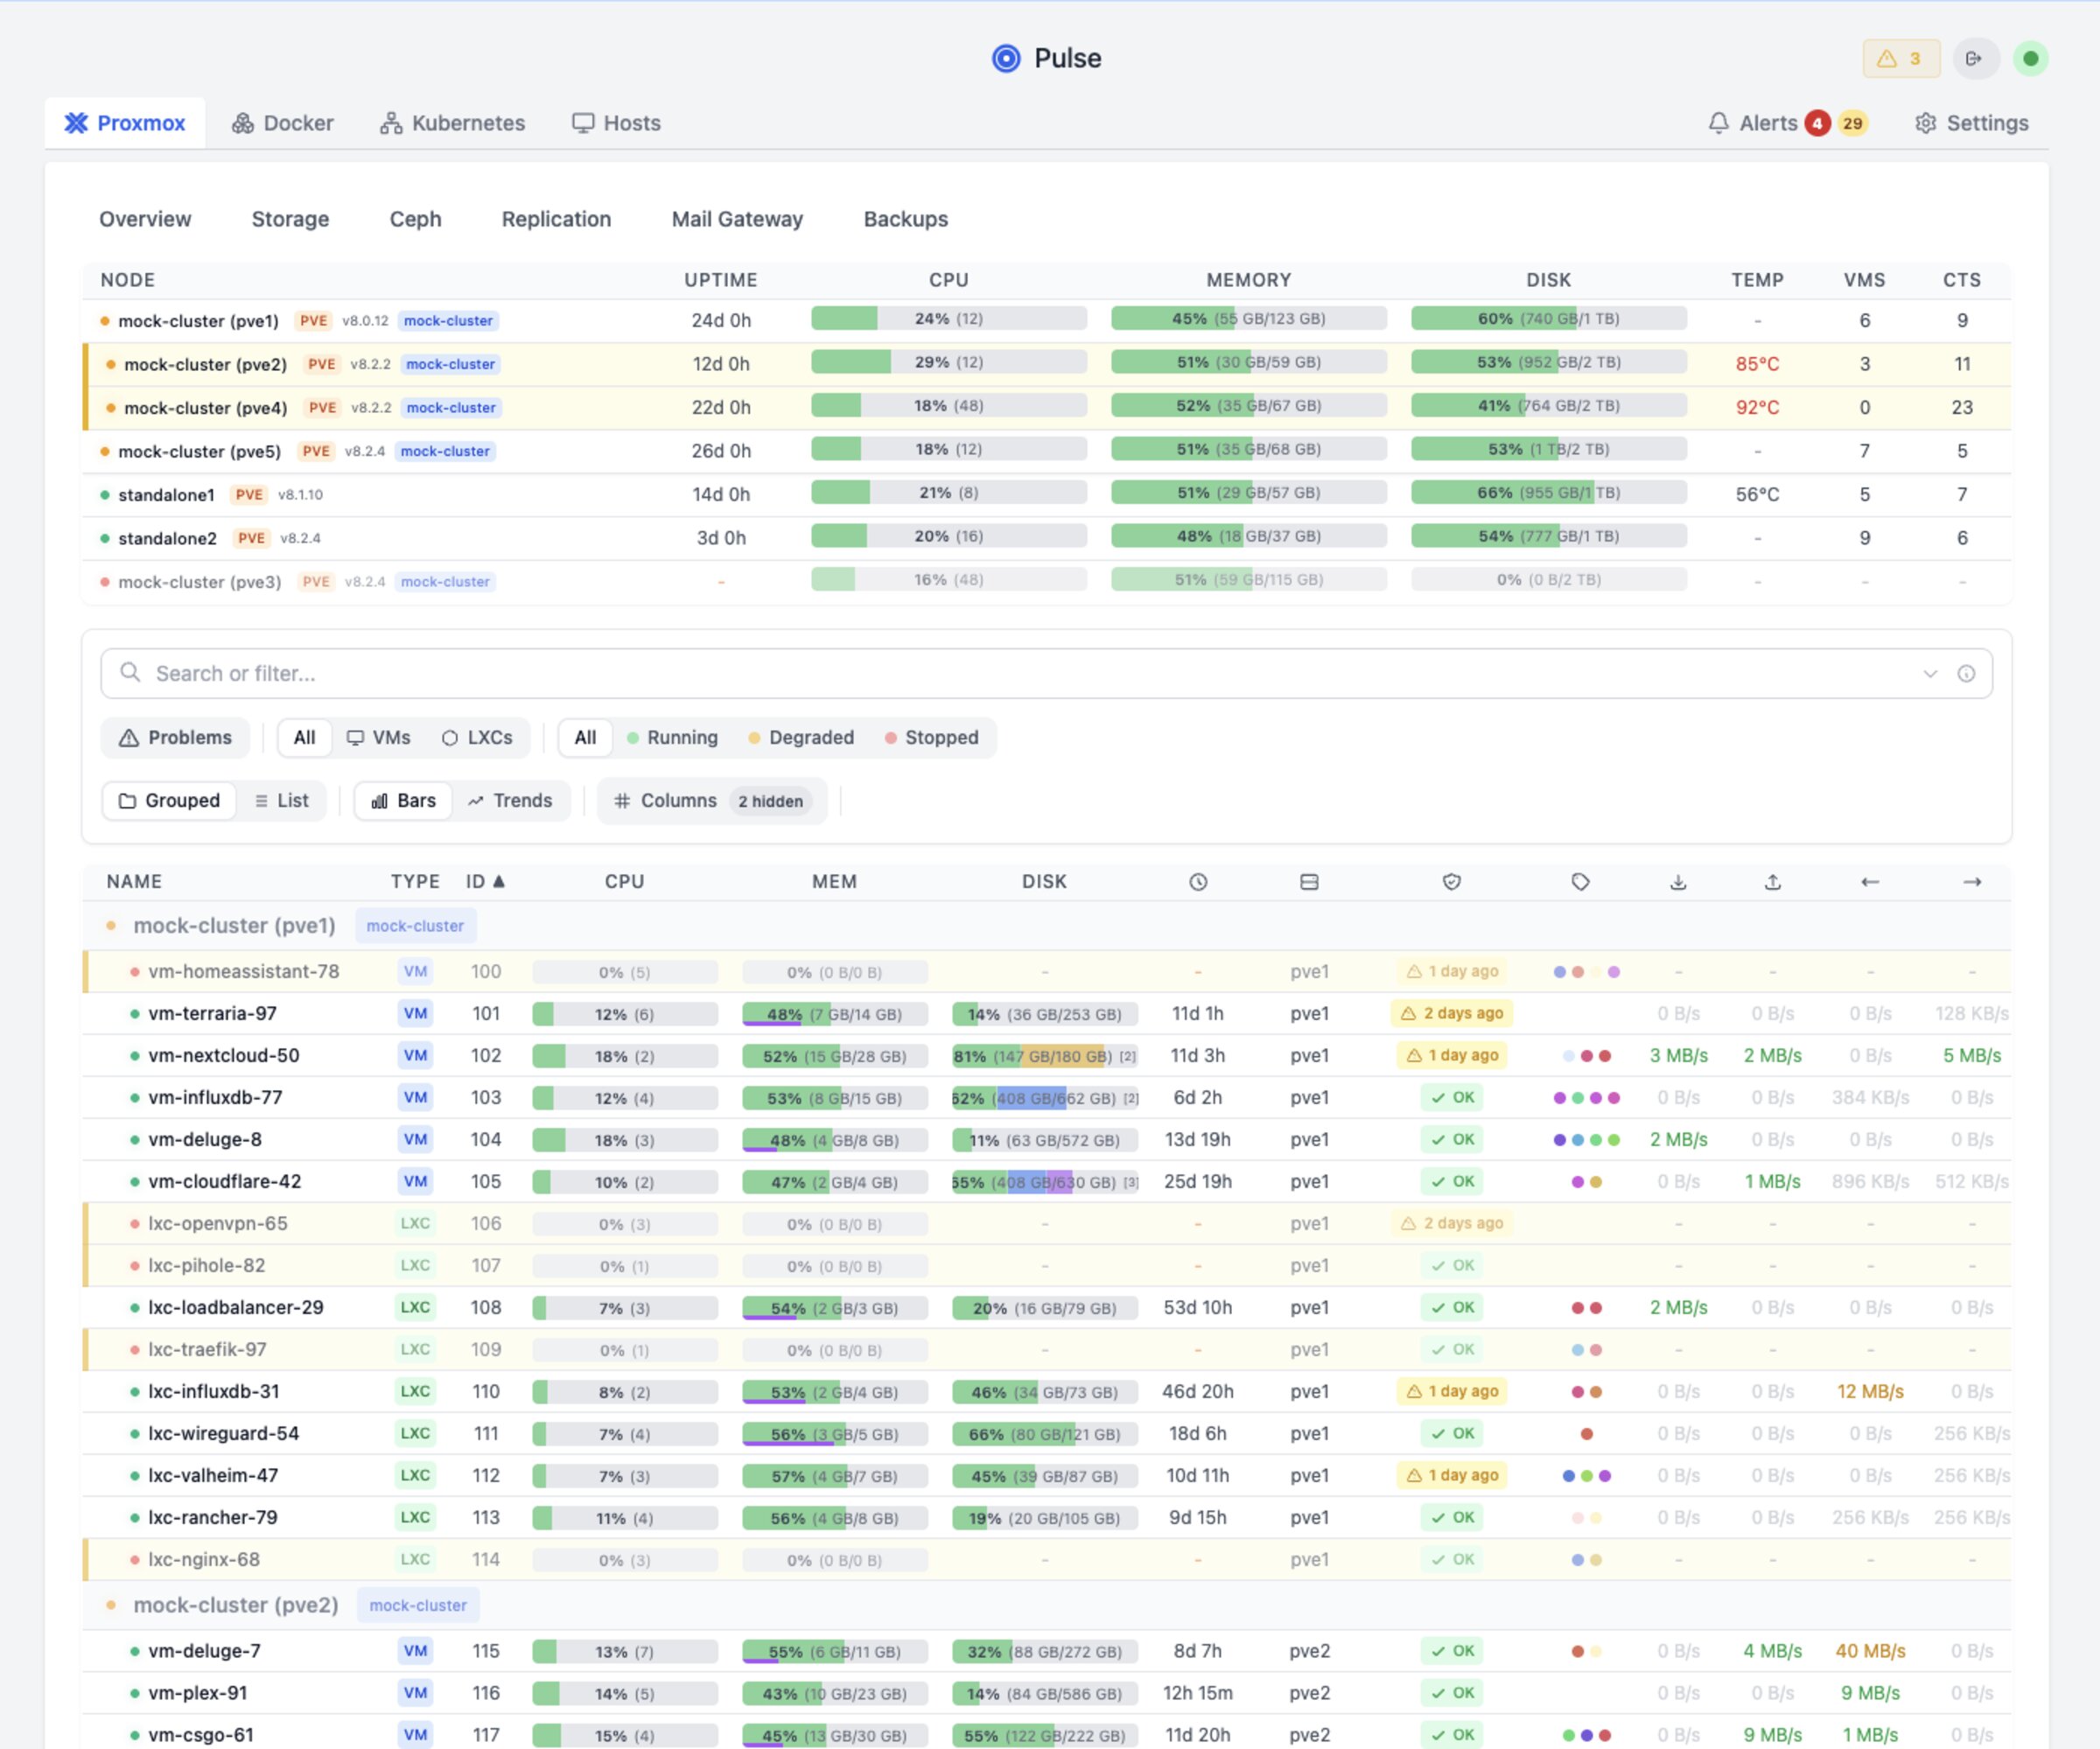
Pulse is different. It doesn't just graph CPU usage. It analyzes why CPU is high, connects it to that failing backup job, and tells you the root cause in plain English.
Real issues from real clusters
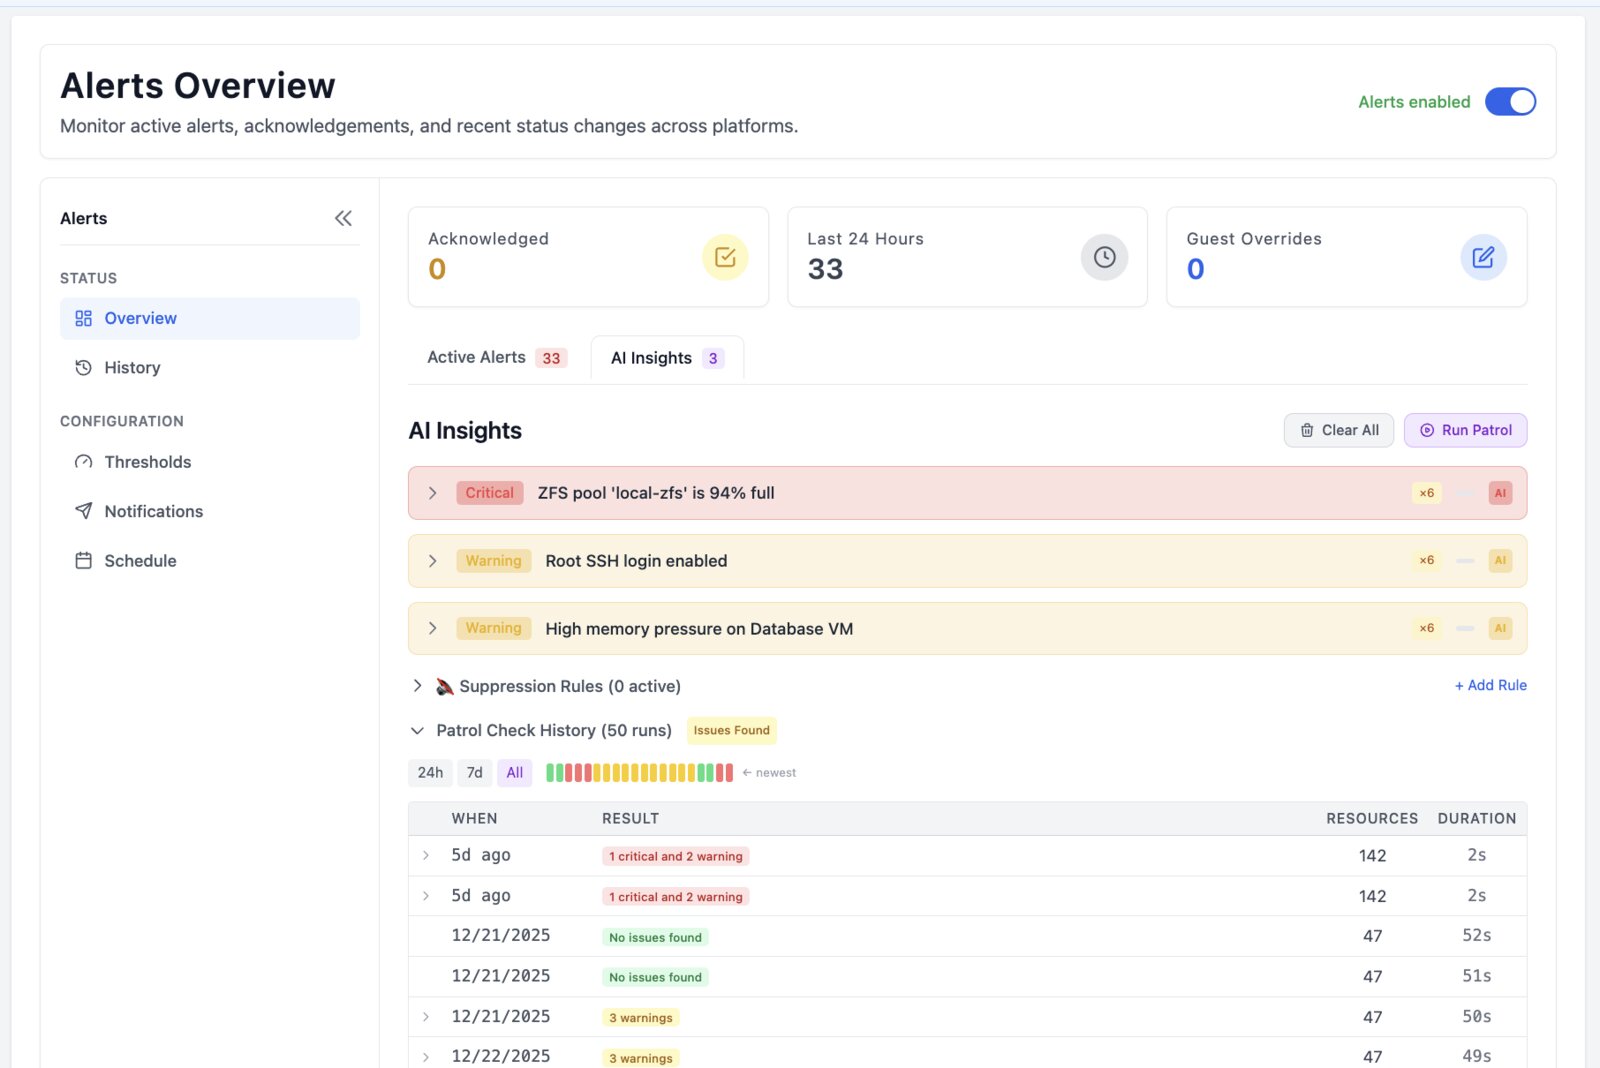
These aren't hypotheticals. These are real findings from production homelabs running Pulse.
At current growth rate, pool will be full in 3 days. ZFS performance degrades significantly above 80%.
6 unexpected reboots in the last 24 hours. Memory usage spikes to 98% before each restart.
"nightly-backup" last succeeded on Dec 18. VM 102 (postgres) has no recent protection.
System time is 47s behind cluster. Can cause ceph issues and VM migration failures.
Container "plex" running but failing health checks on port 32400 for > 2 hours.
Network config differs on node pve3. vmbr0 MTU is 1500 vs 9000 on other nodes.
"Pulse is by far the best way to monitor my Proxmox hosts in a single dashboard. No overwhelming metrics — just what you need."
[CRITICAL] ZFS pool at 94% [WARNING] Backup job failed [WARNING] VM 105 memory pressure
Your infrastructure, not just a chat window
When you ask ChatGPT about your server, you have to describe everything manually. Patrol sees your entire infrastructure at once — with historical context no generic LLM can access.
- Proxmox nodes, VMs, containers
- Docker/Podman hosts & containers
- Kubernetes pods, deployments, services
- PBS/PMG backup status & jobs
- Ceph clusters & OSD health
- ZFS pools & storage usage
- 24h & 7d trends — rising, stable, volatile
- Learned baselines — what's normal for your env
- Capacity predictions — "full in X days"
- Anomaly detection — z-score deviations
- Change tracking — config drift, migrations
- Incident memory — past investigations
- Your notes — "runs hot for transcoding"
- Dismissed alerts — won't nag again
- Past remediations — what fixed it before
- Resource correlations — cross-host patterns
- User feedback — learns from your input
- Suppression rules — expected behavior
This is what makes Patrol catch issues that static alerts miss.
It's not just "CPU > 90%". It's "CPU spiked to 85% but that's normal for this VM during backups, however the backup hasn't completed in 3 hours which is unusual."
The 3am problem, solved
Traditional alerts wake you up with noise. Pulse Pro wakes you up with answers.
Pulse that fixes, not just reports
Patrol doesn't just find problems — it can fix them too. With your approval, Pulse Assistant executes safe remediation commands on connected hosts.
One agent. Every platform.
Install once, monitor everything. The agent auto-detects Docker, Kubernetes, and Proxmox — no manual configuration.
Detects Docker, Podman, Kubernetes, and Proxmox automatically
Agent updates itself when new versions are released
One install command. Works on Linux, macOS, and Synology
Let Pulse run diagnostics and fixes on connected hosts
[install] Detecting platforms... [install] Found: Docker ✓ Kubernetes ✓ Host metrics ✓ [install] Installing pulse-agent to /usr/local/bin/ [install] Creating systemd service... [install] ✓ Agent connected to Pulse
Built for production environments
Running Pulse for a team or business? Pro includes compliance and collaboration features out of the box.
Tamper-proof logs with HMAC signing. Stream to your SIEM via webhooks. Configurable retention.
Define roles and permissions. Control who can view, modify, or execute commands across your infrastructure.
OIDC and SAML support. Connect to Okta, Azure AD, Google Workspace. Map roles automatically.
Generate PDF/CSV reports. Capacity trends, resource usage, patrol history. Share with stakeholders.
Up and running in minutes
Deploy Pulse
Docker or LXC. Add your Proxmox API credentials.
Add your LLM key
OpenAI, Anthropic, or local Ollama. Your choice, your data.
Pulse Patrol starts
Automated scanning on your schedule. Findings appear in Dash.
Free vs Pro
The core dashboard and Pulse Assistant chat are free forever. Pro unlocks automated monitoring.
Free
- ✓ Real-time metrics dashboard
- ✓ Threshold-based alerts
- ✓ Pulse Assistant (Manual Chat)
- ✓ Docker & Kubernetes views
- ✕ Pulse Patrol (Automated 24/7)
- ✕ Auto-Root Cause Analysis
- ✕ Team features (RBAC, SSO, Audit)
Pro Annual
- ✓ Everything in Free
- ✓ Pulse Patrol (Automated 24/7)
- ✓ Auto-Root Cause Analysis
- ✓ Deep Kubernetes Insights
- ✓ Team features (RBAC, SSO, Audit, Reports)
Pro Monthly
- ✓ Everything in Free
- ✓ Pulse Patrol (Automated 24/7)
- ✓ Auto-Root Cause Analysis
- ✓ Deep Kubernetes Insights
- ✓ Team features (RBAC, SSO, Audit, Reports)
What users are saying
"Pulse is by far the best way to monitor my Proxmox hosts in a single dashboard."
"No overwhelming metrics nobody cares about. Just CPU, memory, disk — simple and easy."
"I wanted to try Pulse and instantly fell in love with it once installed."
"Setup Wizard — easy as can be! Upgrade was super easy, no issues at all."
"Really clean, easy to look at interface. Love what you've done with this."
"Found this project and was very impressed. Thank you for your efforts and good work."
See Pulse in action
Community reviews of Pulse